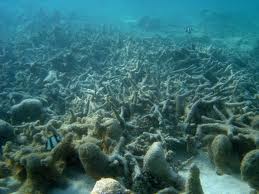
 There are many terrible danger in oil spills. They can, in certain instances if the spill is underwater, cause underwater plumes. These are large areas of ocean water that is contaminated with petroleum products. These products are immensely toxic to underwater ecosystems and environments, as they are detrimental to the sea life. They kill corals, fish, micro-life of all kinds, sea plants, and just about anything down there. The destruction of these "producers" in the food chain can produce catastrophic results for the ecosystem around them. These dispersants, or toxic materials that disperse amongst the waters, can harm any life that comes into contact with them. Professional physical oceanographers make a living of exploring the effects of multiple environmental factors on the ocean, including negative ones, such as spills. Their work is to study, predict, and investigate such events, and contribute an
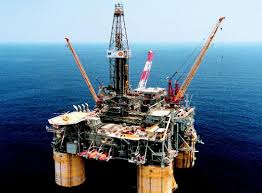
 There are many ways of detecting oil spills. A main way is using an instrument that detects colored dissolved organic matter (CDOM) called a CDOM flourometer. This instrument detects the color and transparency of the ocean water. In addition to CDOM flourometers, CTD (conductivity, temperature and depth) sensors are also used to look at the water to detect any changes in the waters chemistry. Moving Vessel Profilers (MVP) can also be used to measure any changes in the water's chemistry, even while the vessel is underway. What I found particularly fascinating about all of this was the variety of tools used specifically for detecting oil and their accuracy. The ability that the scientists currently have to measure the ocean's health with is
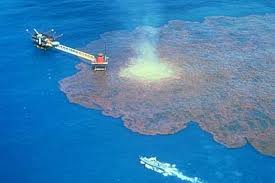
 When there is an oil spill, many questions are pondered. However, there isn't much time to think, as more doing obviously needs to be done. Using gas chromatography and mass spectrometry, the oil can be chemically identified to a specific origin. The NOAA has a tool called GNOME that uses things like tide, currents, wind conditions and other factors to determine where the spill will go. ESI (Environmental Sensitivity Index) maps can help determine what will happen to the area and what the oil will affect in the area. Combining all of this knowledge can help to create a serious and effective plan of action when a spill occurs, and can help keep the ocean safe and healthy. One thing I found particularly fascinating was the technology used for all of this insight and research. The tools and equipment used to assess and forecast spills and spill plans are all very intriguing. As well as the fact that they are able to predict such things and help out so much is very cool.
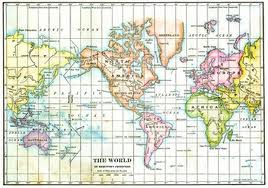 Latitude and longitude are the basic tools for finding locations on the globe. Using them, you can pinpoint any spot on the earth that you wished. Longitude are imaginary lines running from the north pole (top of the globe) to the south pole (bottom of the globe). They are used to measure how far something is east or west from the prime meridian- an imaginary, fixed line of 0 degrees (east or west) that runs through Greenwich, England. Latitude run from it's prime line, the equator. This is a line that belts around the globe, directly in between the north and south poles. Imaginary lines above and below it are used to determine a points location north or south. A common representation of these lines is called the Mercator projection, which displays the lines on a flat plane (shown above). This makes for an easy reading and understanding of a location on the earth.
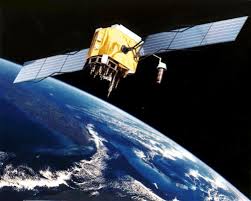
 Marine oceanographers use devices called CTS's (conductivity, temperature and salinity) to measure these factors as well as temperature at different depths. They use these to study areas of interest to locate deep sea plumes. Plumes are the giant "clouds" of minerals with raised temperatures that hydrothermal vents give off. These plumes lead them to the vents, so they can then be studied. To guess where the plumes are, they look at existing maps of the ocean floor made my satellites in space. Areas of interest that look like they could hold plumes are then visited, and the water around the area is read and measured by CTD's. If a plume is detected, it is then followed, and they locate the hydrothermal vent. A ROV or AUV is then sent down to the site to investigate, conduct research, and simply explore. One part of all of this that particularly fascinated me was the deep sea life found at these vents. Tons of barnacles and shrimps and crabs swarm the place, as well as the usual tube worms. However, not all of the animals seen down there are currently known in the scientific community, and their species is a mystery. And there is question to the ones they do know of: are they the same size as other known groups around the world? Do they differ in any way, behavioral or visibly? It's a very extensive system, though incredibly fascinating.
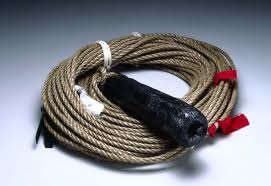 Back in the olden days of ocean navigation, before modern technology allowed sonar readings of the ocean floor, sailors had no way of telling how deep or shallow the water was underneath them. So, they performed what were called "soundings" to chart the ocean. In doing so, they lowered a rope with marked length intervalls with a piece of lead at the end. They would drop the lead over the boat and when it hit the bottom, they would chart how far it had fallen and where. Now, technology allows for the easy scanning of the sea floor by electronic sonar systems that bounce sound waves off of the bottom of the ocean to determine it's depth and characteristics. This makes readings much more detailed, accurate, and far quicker to perform over much larger areas.
 Telepresence is the ability to send images or data over a broadband connection (meaning that a large amount of data can be sent over a single connection) to any receiver so that multiple people can view the same feed live within the scientific community. Telepresence is changing the way that ocean exploration is done because it allows the quicker investigation of areas found by cameras linked to telepresence, and the video can be viewed by an incredibly large number of people at the same time, live.
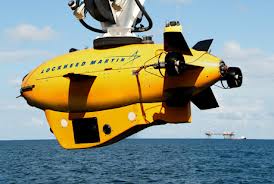 Underwater robots are used for marine study, research, and exploration. They come in two distinct varieties, Remotely Operated Vehicles (ROV's) and Autonomous Underwater Vehicles (AUV's). What I found fascinating about them was their capability to conduct incredible amounts of research and data collecting. They can have multiple underwater sensors and gauges, and can take many different readings and measurements of the underwater environment. They can travel under their own power, and can take people to incredible places that only a few have ever been. They allow people to explore to the extreme, and help us as a whole to understand the place in which we live.
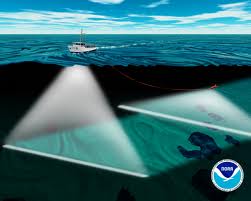 Basic sonar sends acoustic sound waves down into the ocean, and measures the time elapsed from sending the sound pulse to receiving it back to determine the depth of the water. Multibeam sonar uses multiple beams to create a great path and intricate detailed map of the ocean floor, including any objects on the floor. This helps marine scientists gather geographic data about the ocean floor, and is used in many other industries as well, such as fishing and the location of shipwre
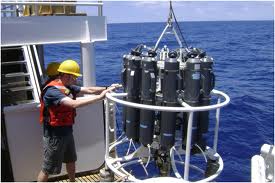
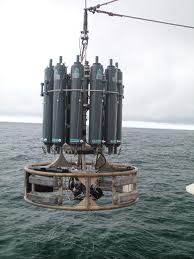 CDT stands for Conductivity, Temperature and Depth. It helps scientists locate points of interest underwater, such as chemosynthetic communities. It also helps reveal information about ocean currents, using the temperature with the conductivity to calculate density, all of which are major driving factors for currents. It is collected via a machine that contains many tanks, which open individually at separate depths, collecting samples that can be observed when retrieved in the lab. What interested me most was the mechanism in which they are able to effectively gather the data with, because it is so methodical and well thought out. It seems incredibly inventive,
|
 RSS Feed